使用matplotlib绘制各种图像
最近由于论文的需要,要用到matplotlib绘制图像,这里顺便总结一下!
我是用cv2读取图片,最近发现了一个奇异的问题,在一个目录下用相对路径读取读片(相对路径没有英文),新建一个notebook文件可以读取,但是把别的地方的notebook文件拷贝过来就不行了,一直返回None,虽然不知道是什么原因,但以后需要注意啊!!!
1. 基本matplotlib设置
1 | import cv2 |
2. 同时显示多个图像
因为matplotlib显示是从小到大排列,比如要显示10张图像,并分2为行显示,显示的子图序号是251、252、…、2510,这是不行的,因为2510不被识别,因此采用这种方式显示图片有个数限制。
所以,用虽然用下面的方法可以同时显示多个图像,但是最多不超过10张。
1 | # 同时显示多个图像 |
3. 同时显示多个图像(无个数限制)
1 | """ |
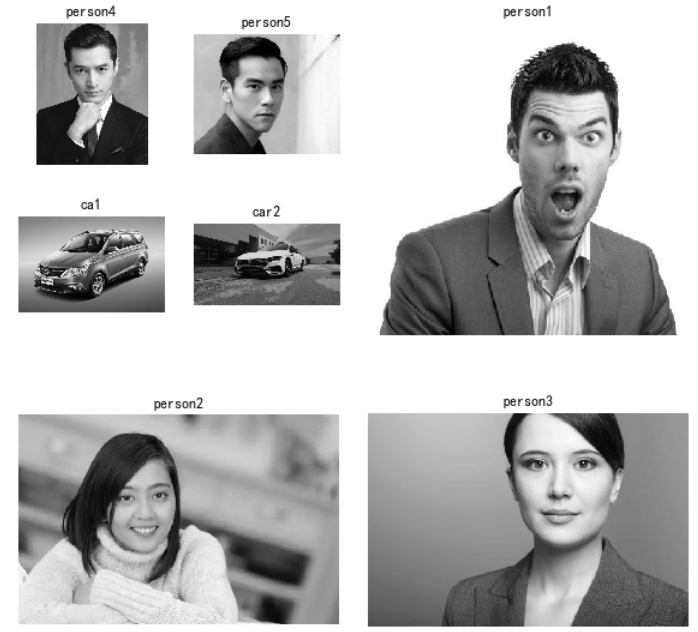
4. 多个大小不同的图像
1 | # 显示不同级别的小波图像 |
可以运行一下看看效果:
1 | # len(imgs) =7 |
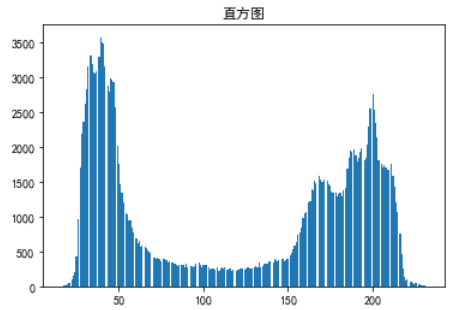
5. 直方图
1 | # 读取图像 |
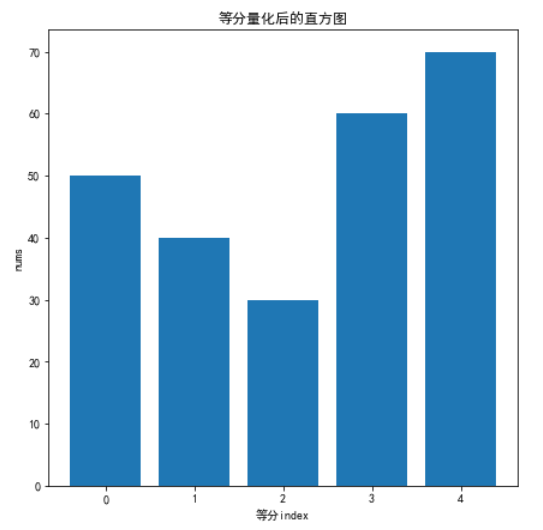
1 | def show_hist_quantized(histogram_quantized): |
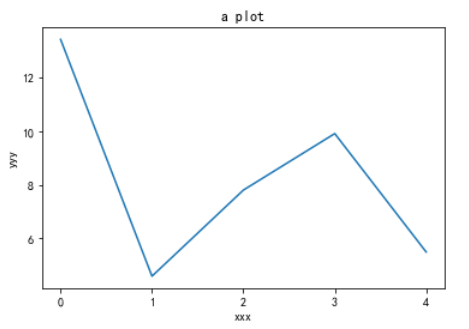
6. 坐标轴为整数的折线图
1 | import matplotlib.pyplot as plt |